
LEARN MORE ABOUT YOUR MAPPED SOLAR SYSTEMLearn More
Solar System Details
Take me to more information about…
 Panel Group Details
If you have mapped more than one group of panels, you can tap or click through each Panel Group tile to compare how they perform. The Complete System tile shows you how the system performs as a whole.
To select a different group, tap or click Show panel group/complete system performance > in the top right corner of the tile.
-
This figure is an estimate of how much energy your solar panels could generate in a year with average weather for your area.
-
For residential properties, SunSPOT uses solar panels that are 1.13m x 1.72m and have a capacity of 400W.
For commercial properties, SunSPOT uses solar panels that are 1.05m x 2.07m with a power output of 440W.
-
The panel tilt is the angle that this group of solar panels makes with the horizontal.
The orientation of the panels is the direction that this group of solar panels is facing. North facing panels usually perform best, but east and west facing panels can perform well in the morning and evening respectively.
Changing the tilt and orientation of the panels can change how well the group performs.
 Solar Generation
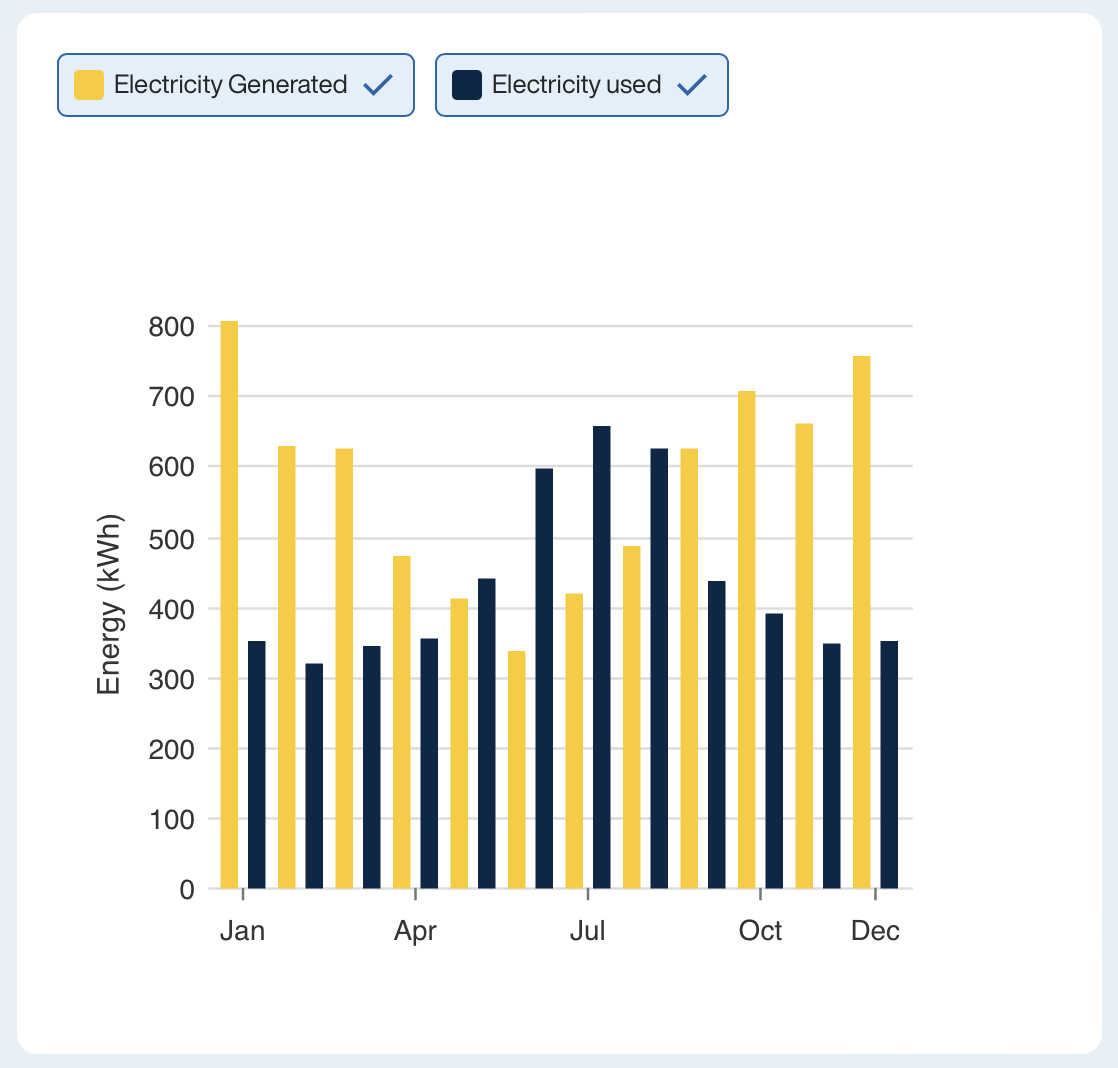
This chart shows your estimated monthly electricity usage compared to the estimated monthly solar generation for the selected panel group.
You can use this chart to compare the performance throughout the year of similar sized panel groups in different positions on your roof.
 Sun Path and Shade Profiles
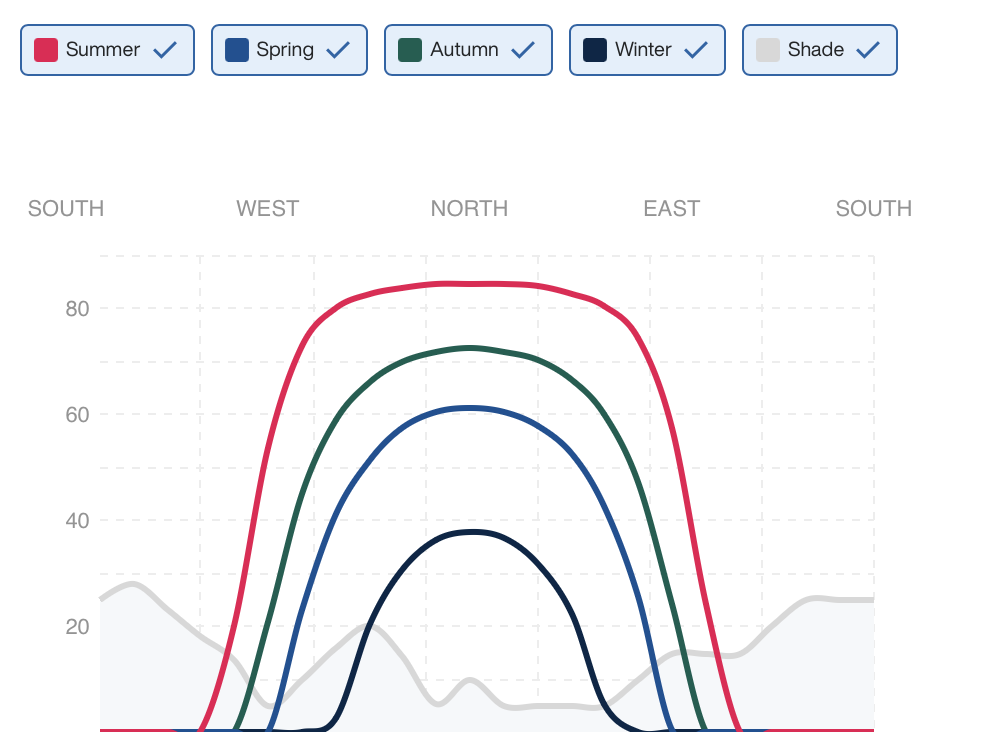
A sunpath diagram shows the position of the sun - each coloured line shows the height of the sun in different months of the year.
The grey areas on the sunpath diagram indicate where there are trees and buildings visible from your selected panel group. During times when the grey area overlaps the sun’s path, at least 25% of the solar panels in this group will be shaded, which will significantly affect the output.
Shading during the middle of the day when there is a lot of solar energy available should be avoided. Morning and afternoon shade is less important. SunSPOT accounts for shading losses when calculating the energy generated by a PV system.
For an in-depth explanation of sun-path diagrams, you can watch this 5 minute video.